| Author: | |
| Website: | |
| Page title: | |
| URL: | |
| Published: | |
| Last revised: | |
| Accessed: |
Elsewhere in this section we describe how to find an approximation of the slope of the tangent at a point P on the graph of a non-linear function by choosing a second point on the graph very close to P and taking the slope of the secant that intersects both points. We can find the slope of the secant by plugging the x and y coordinates of the two points into the standard formula for the slope of a straight line. Providing the two points are close enough together, we will get a good approximation of the slope of the tangent to the curve at point P. Here once again is the standard formula for the slope m of a straight line:
| m = | y2 - y1 |
| x2 - x1 |
You might also recall that we don't actually need to specify the second point on our curve. We simply need to pick an arbitrarily small value to represent the horizontal distance h between the two points. We can choose whatever value we like for h - the smaller the better. All we need to know in order to find the slope of the secant is the x coordinate for point P. If we call this x, the x coordinate of the second point will be x + h. The y coordinates required by the formula are obtained by plugging the x coordinates into our original function. The formula for the slope of the tangent (the derivative) at point P is therefore:
| Slope of tangent to P = | lim | ƒ(x+h) - ƒ(x) | |
| h→0 | h |
The limit notation used here tells us that the result we get approaches the slope of the tangent as h approaches zero. It is still an approximation. When we want to show that we are talking about some change in the value of a variable, we often use the lower case Greek letter delta (δ). The variable h represents the difference between two values of the independent variable x. We could therefore replace h in our formula with the term δx. Similarly, the expression ƒ(x+h) - ƒ(x) represents the difference between two values of the dependent variable y, so we could replace this expression with the term δy. This allows us to rewrite our formula in a more concise form (i.e. using delta notation) as:
| Slope of tangent to P = | lim | δy | |
| δx→0 | δx |
We can use the slope formula with some arbitrary value of δx to find a derivative. Let's look at a couple of examples. We'll start with the graph of the function ƒ(x) = x 2, and try and find the slope of the graph at various points on the graph.

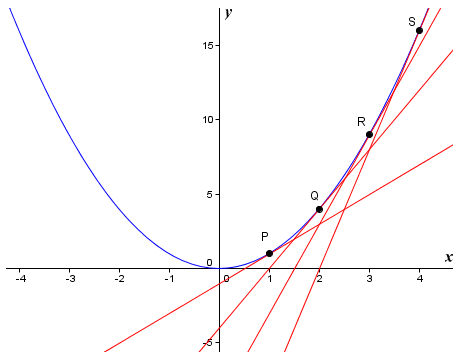
The graph of the non-linear function ƒ(x) = x 2
We have shown tangents to the graph of the function ƒ(x) = x 2 at points P (x = 1), Q (x = 2), R (x = 3), and S (x = 4). The tangents represent the slope of the graph at these points. We will start by finding an approximation for the slope mP of the graph at point P, using a value for δx of 0.01:
| mP = | δy | = | (1 + 0.01) 2 - 1 | = | 0.0201 | = 2.01 |
| δx | 0.01 | 0.01 |
Now let's find approximations for the slope of the graph at points Q, R and S:
| mQ = | δy | = | (2 + 0.01) 2 - 4 | = | 0.0401 | = 4.01 |
| δx | 0.01 | 0.01 |
| mR = | δy | = | (3 + 0.01) 2 - 9 | = | 0.0601 | = 6.01 |
| δx | 0.01 | 0.01 |
| mS = | δy | = | (4 + 0.01) 2 - 16 | = | 0.0801 | = 8.01 |
| δx | 0.01 | 0.01 |
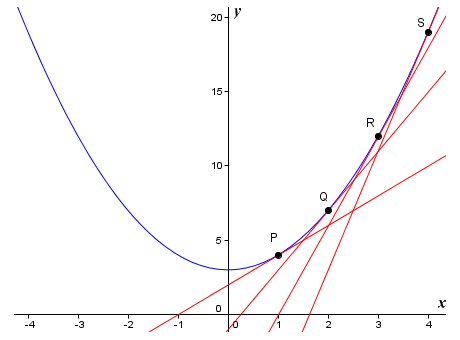
It is reasonable to conclude that if we took a much smaller value for δx, our approximations would become more accurate. The value of mP, for example, would get much closer to two (2). Note that each time the value of x increases by one (1), our approximation for the slope of the tangent increases by two (2). This would seem to indicate that the slope of the function at any point on the graph is 2x. What will happen if we carry out the same exercise for the function ƒ(x) = x 2 + 3 using the same value of δx and the same x values for points P, Q, R and S? Here is the graph:

The graph of the non-linear function ƒ(x) = x 2 + 3
We will now find approximations for the slope of the graph at points P, Q, R and S:
| mP = | δy | = | ((1 + 0.01) 2 + 3) - (1 + 3) | = | 0.0201 | = 2.01 |
| δx | 0.01 | 0.01 |
| mQ = | δy | = | ((2 + 0.01) 2 + 3) - (4 + 3) | = | 0.0401 | = 4.01 |
| δx | 0.01 | 0.01 |
| mR = | δy | = | ((3 + 0.01) 2 + 3) - (9 + 3) | = | 0.0601 | = 6.01 |
| δx | 0.01 | 0.01 |
| mS = | δy | = | ((4 + 0.01) 2 + 3) - (16 + 3) | = | 0.0801 | = 8.01 |
| δx | 0.01 | 0.01 |
Looking at these results, you will no doubt realise that the addition of a constant term - in this case three (3) - makes no difference to our results for the chosen values of x. In fact, this is not really surprising since the shape of the graph has not changed. Adding a constant term to a function simply moves the graph up or down, depending on whether the constant term is positive or negative.
We have been careful to emphasise that the values we have been calculating for the slope of the graph at various points have been approximations. This is because no matter how small we make δx, we are talking about the slope of a secant that intersects the point we are interested in rather than the actual tangent to the curve at that point. The answer we get may be a very good approximation, but it is still an approximation. Furthermore, the method we are using to find the derivative is not particularly elegant, since we have to plug some arbitrary value of δx into our formula. It would be nice if we could somehow eliminate δx and δy from our calculations and come up with a formula that gives us an exact value for the derivative. Let's look again at the simple non-linear function ƒ(x) = x 2.
We want to find the slope of the graph at some point P which has coordinates (x, y). Going back to first principles, we will choose another point on the curve very close to P so that we can draw a secant with a slope that closely approximates that of the tangent to the curve at P. We will call this point Q. The coordinates of point Q are (x + δx, y + δy). Since we are looking at the graph of the function ƒ(x) = x 2, we know that:
y + δy = (x + δx) 2
If we expand the brackets we get:
y + δy = x 2 + 2x(δx) + (δx) 2
But since y is equal to x2, we can simplify this to:
δy = 2x(δx) + (δx) 2
So the gradient of secant PQ is given by:
| δy | = | 2x(δx) + (δx) 2 | = | δx(2x + δx) | = 2x + δx |
| δx | δx | δx |
If we let δx become zero, we get the formula for the slope at any point P on the graph of the function ƒ(x) = x2. It is simply 2x. We can express this as:
| Slope of tangent to P = | δy | = | lim | 2x + δx = 2x | |
| δx | δx→0 |
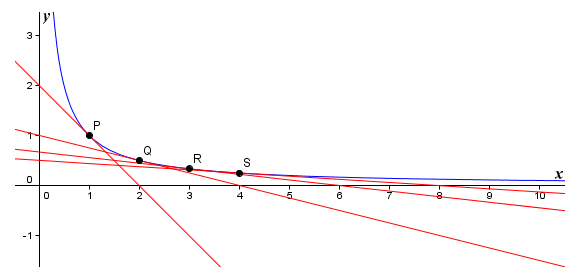
This result is fully supported by the approximations we obtained earlier for the slopes at points P, Q, R and S using an arbitrary value for δx. Let's differentiate another simple curve. The image below shows the graph of the non-linear function ƒ(x) = 1/x, together with the tangents at points P (x = 1), Q (x = 2), R (x = 3), and S (x = 4).

The graph of the non-linear function ƒ(x) = 1/x
We will find approximations for the slopes of the tangents at points P, Q, R and S using an arbitrary value of δx, as we did earlier. This time we will use a value for δx of 0.0001.
| mP = | δy | = | (1 ÷ (1 + 0.0001)) - (1 ÷ 1) | = | -9.9990×10⁻⁵ | = -0.9999 |
| δx | 0.0001 | 0.0001 |
| mQ = | δy | = | (1 ÷ (2 + 0.0001)) - (1 ÷ 2) | = | -2.4999×10⁻⁵ | = -0.25 |
| δx | 0.0001 | 0.0001 |
| mR = | δy | = | (1 ÷ (3 + 0.0001)) - (1 ÷ 3) | = | -1.1111×10⁻⁵ | = -0.1111 |
| δx | 0.0001 | 0.0001 |
| mS = | δy | = | (1 ÷ (4 + 0.0001)) - (1 ÷ 4) | = | -6.2498×10⁻⁶ | = -0.0625 |
| δx | 0.0001 | 0.0001 |
Once again, these values are only approximations. We need to eliminate δx and δy from our calculations to get a more precise result. Let's look at the function again. As before, let's assume we are looking for the slope of the graph at some point P which has coordinates (x, y). We will choose another point Q on the curve that is very close to P, so that we can draw a secant that has a slope close to that of the tangent to the curve at P. The coordinates of point Q are (x + δx, y + δy). Here is the slope formula once again:
| δy | = | ƒ(x + δx) + ƒ(x) |
| δx | δx |
Since we are looking at the graph of the function ƒ(x) = 1/x, we get:
| δy | = |
|
|||||
| δx | δx |
| δy | = |
|
||
| δx | δx |
| δy | = | -δx |
| δx | x(x + δx)δx |
| δy | = | -1 |
| δx | x 2 + x(δx) |
If we let δx become zero, we get the formula for the slope of the tangent to any point on the graph of the function ƒ(x) = 1/x. We can express this as:
| Slope of tangent to P = | dy | = | lim | -1 | = - | 1 | |
| dx | δx→0 | x 2 + x(δx) | x 2 |
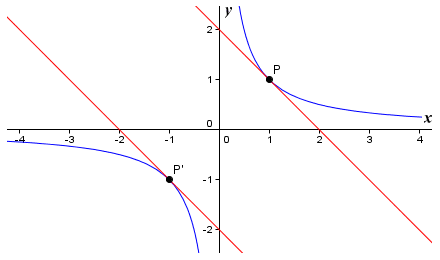
Here too, the results we obtained earlier using an arbitrary value of δx fully support this result. As before, adding a constant value to the function makes no difference to the shape of the graph, it just moves the graph up or down, depending on whether the constant term is positive or negative. Note however that the function is not continuous - its value is undefined at x = 0, so we cannot differentiate the function for x = 0. Note also that the graph for negative values of x is a reflection in the x and y axes of the graph for positive values of x. The slope of the graph for any negative value of x is therefore the same as the slope of the graph for the corresponding positive value of x.

Corresponding positive and negative values of x give the same derivative
It would appear from the above that we can, at least for simple non-linear functions, find the exact slope of the function for any value of x. We don't need to rely on plugging arbitrary values of δx into a formula to get an approximation. We simply need to apply algebraic principles to the problem in order to obtain a general expression for the derivative of a non-linear function for any value of x. This method of finding the derivative is sometimes called the delta method of differentiation because it involves the use of delta notation. We can use the same method to find the derivatives of more complex non-linear functions, although you will probably be pleased to know that we don't really need to. There are a number of relatively simple rules for carrying out differentiation that can save us a lot of work once we learn how to apply them. Using these rules, we can find the derivative of a differentiable non-linear function for any value of x.